DataDive
Supporting Readers’ Contextualization of Statistical Statements with Data Exploration


Duy Khanh Le
HCMUT

Gionnieve Lim
SUTD


Yoojin Hong
KAIST
Duy Khanh Le
HCMUT
Gionnieve Lim
SUTD
Yoojin Hong
KAIST
Statistical statements that refer to data to support narratives or claims are commonly used to inform readers about the magnitude of social issues. While contextualizing statistical statements with relevant data supports readers in building their own interpretation of statements, the complexity of finding contextual information on the web and linking statistical statements with it impedes readers’ efforts to do so. We present DataDive, an interactive tool for contextualizing statistical statements for the readers of online texts.
DataDive supports exploring diverse contextualizations around statistical statements while reading online texts. DataDive is implemented as a browser extension with a backend server to serve the technical pipeline. The user can interact with DataDive in following three steps.
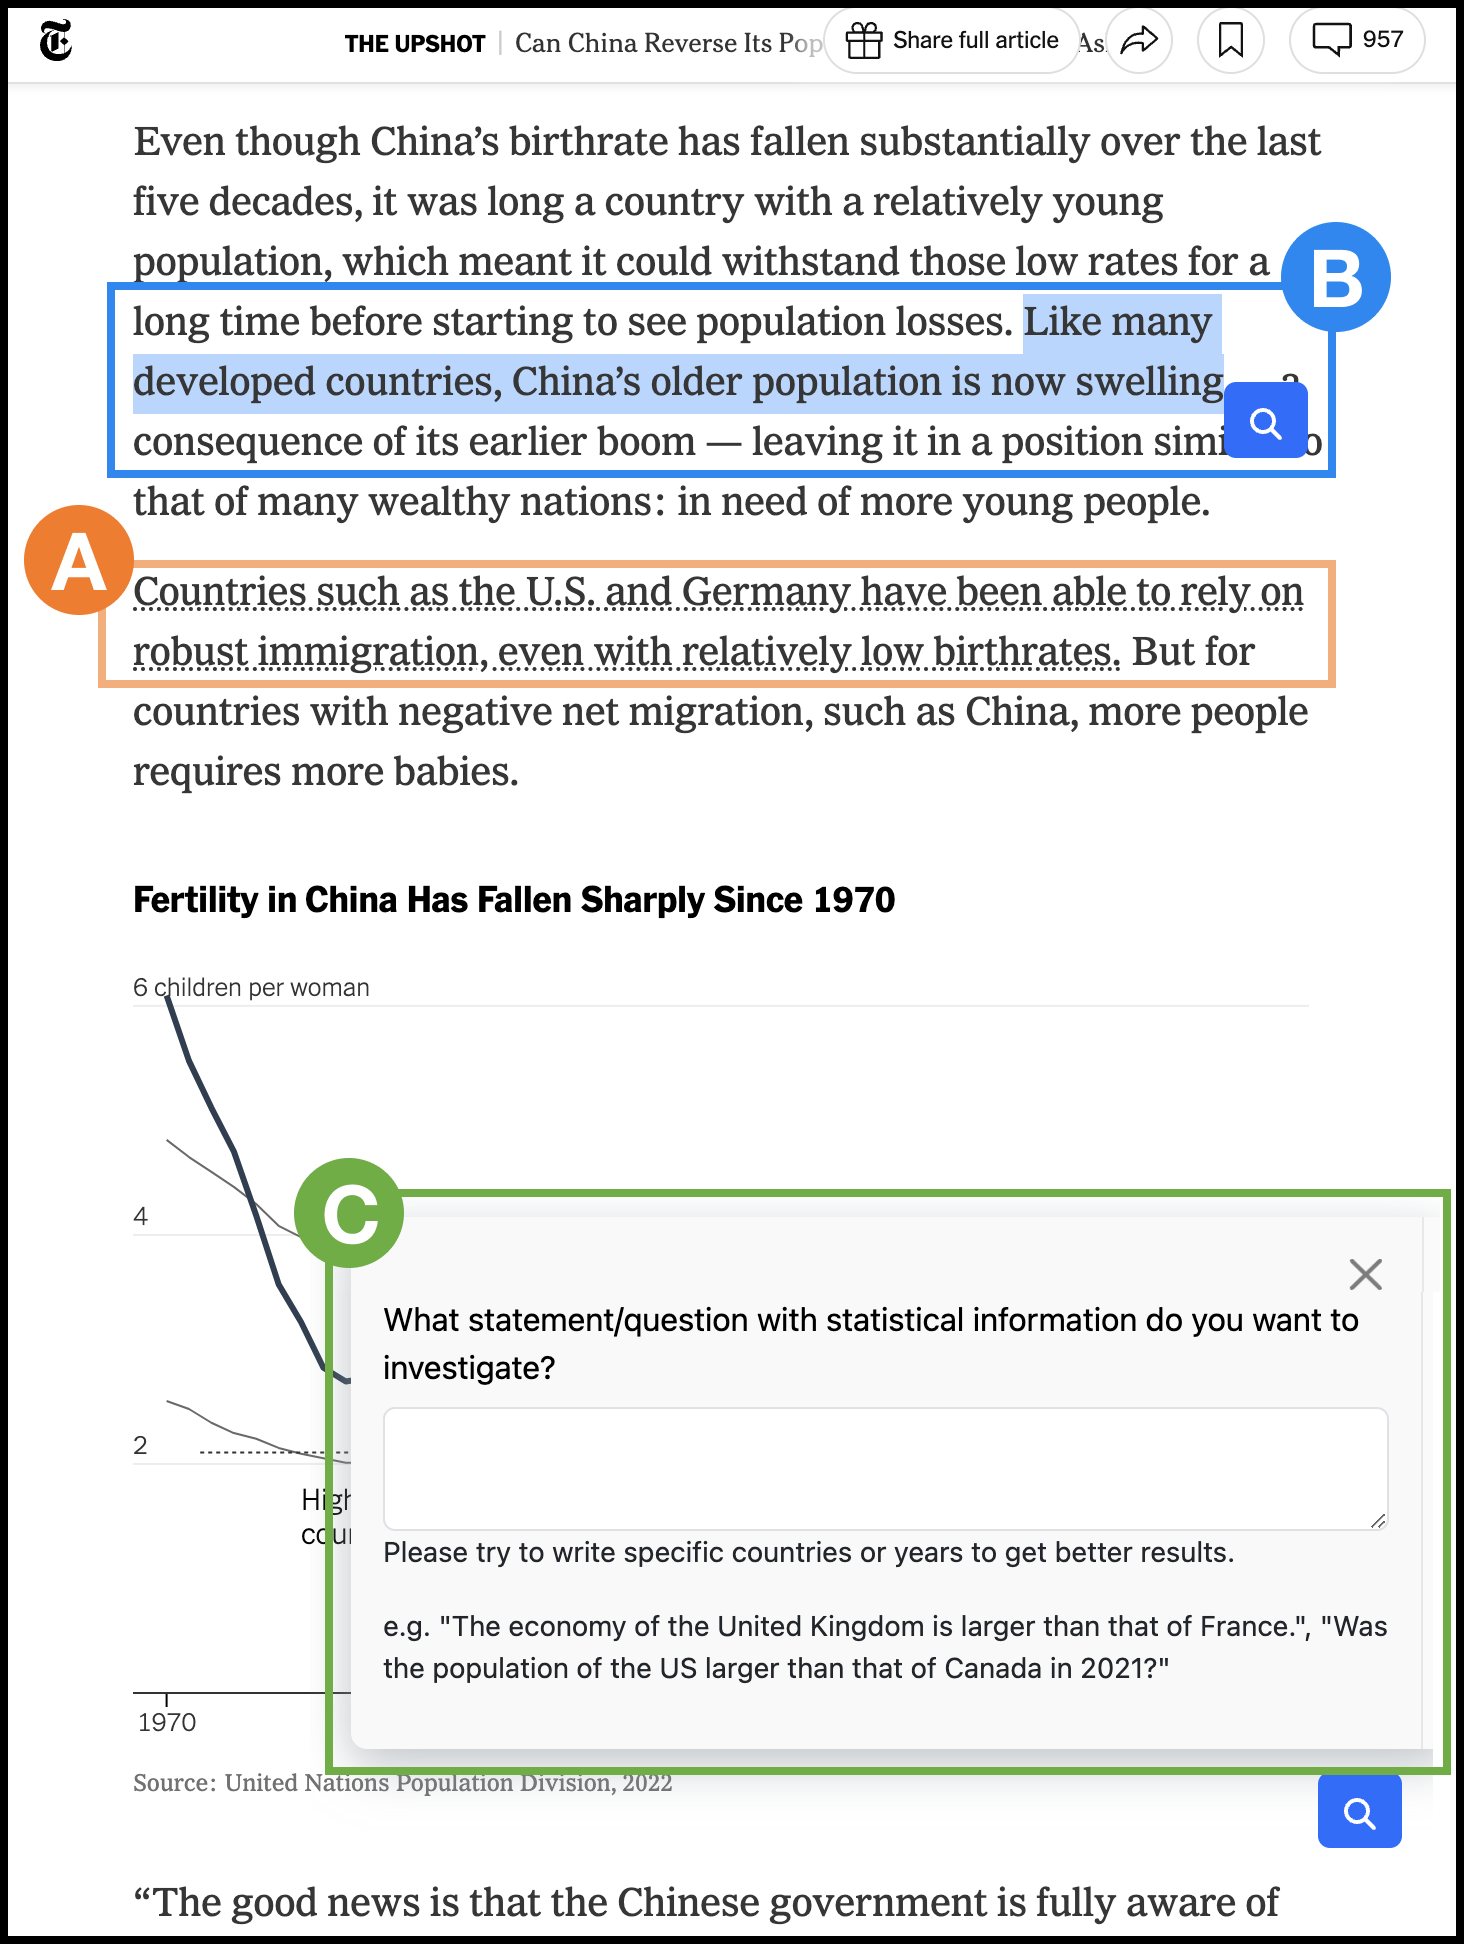
The user can select a statistical statement of interest by (a) clicking a pre-highlighted statement within the article or (b) directly selecting a part of text, The user can also (c) directly write their question of interest.
Upon selecting a statistical statement, DataDive presents a list of context candidates generated by the system. Each candidate consists of either a set of entities, a time period, or a set of statistical indicators, which are three key components of statistical statements. It also includes a thought-provoking question to explain why the recommended context was provided. The user can select one of the potential context of interest.
When selecting a context candidate, DataDive provides a visualization of the most relevant data. The user can freely explore other statistical indicators or entities. DataDive also provides information on the source and the definition of the data to ensure the credibility of the data.
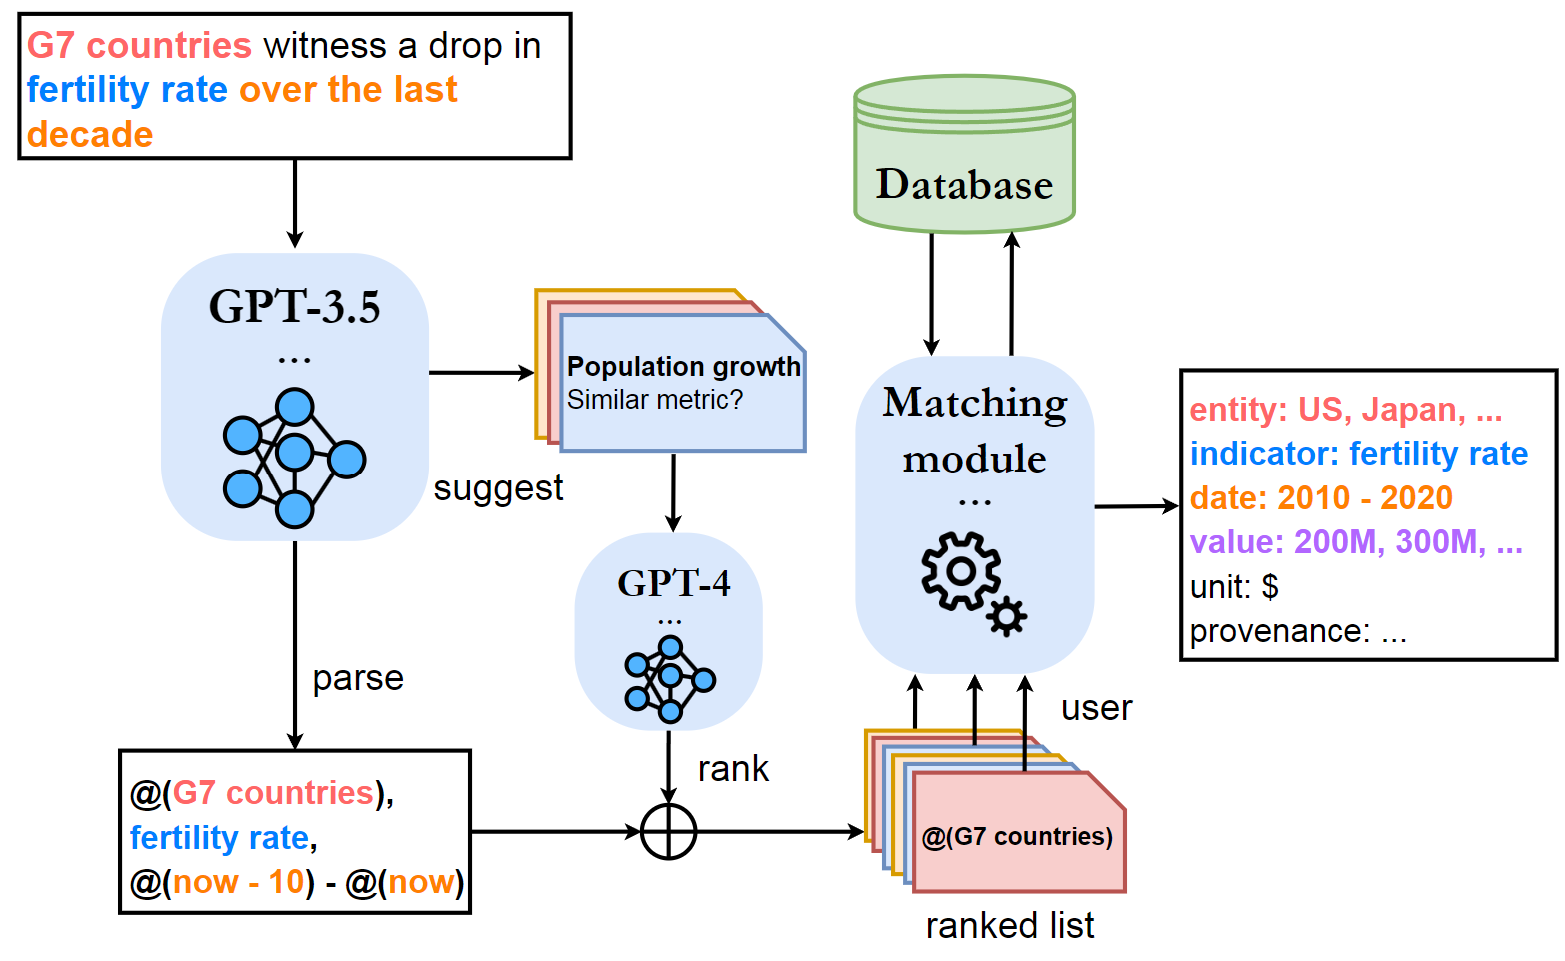
DataDive utilizes an LLM-powered pipeline to (a) generate potential contexts from a statistical statement and (b) retrieve data values relevant to the selected potential context.
DataDive first parses the statement to extract entities, time period, and statistical indicators using a fine-tuned GPT-3.5 model. For example, with the statement “Korea’s fertility rate dropped to 0.8 in 2019.”, the pipeline extracts an entity “Korea”, time period 2019, and a statistical indicator fertility rate.
Based on the parsed results, DataDive generates a list of candidate contexts in terms of each component with GPT-3.5 model. Combining the generated context with other components in the original statement, each candidate context define a triplet of (entity, time period, statistical indicator).
The generated contexts are ranked by their value using a GPT-4 model.
To retrieve the data value on the selected context, DataDive maps each component of (entity, time period, statistical indicator) triplet to the data table. The pipeline first tries exact matching. If the exact matching does not work, such as variations (e.g., GDP vs. G.D.P.), synonyms (e.g., birth rate vs. fertility rate), or implicit references (e.g., countries with low birth rate, last 50 years), the pipeline resolves them with following strategies:
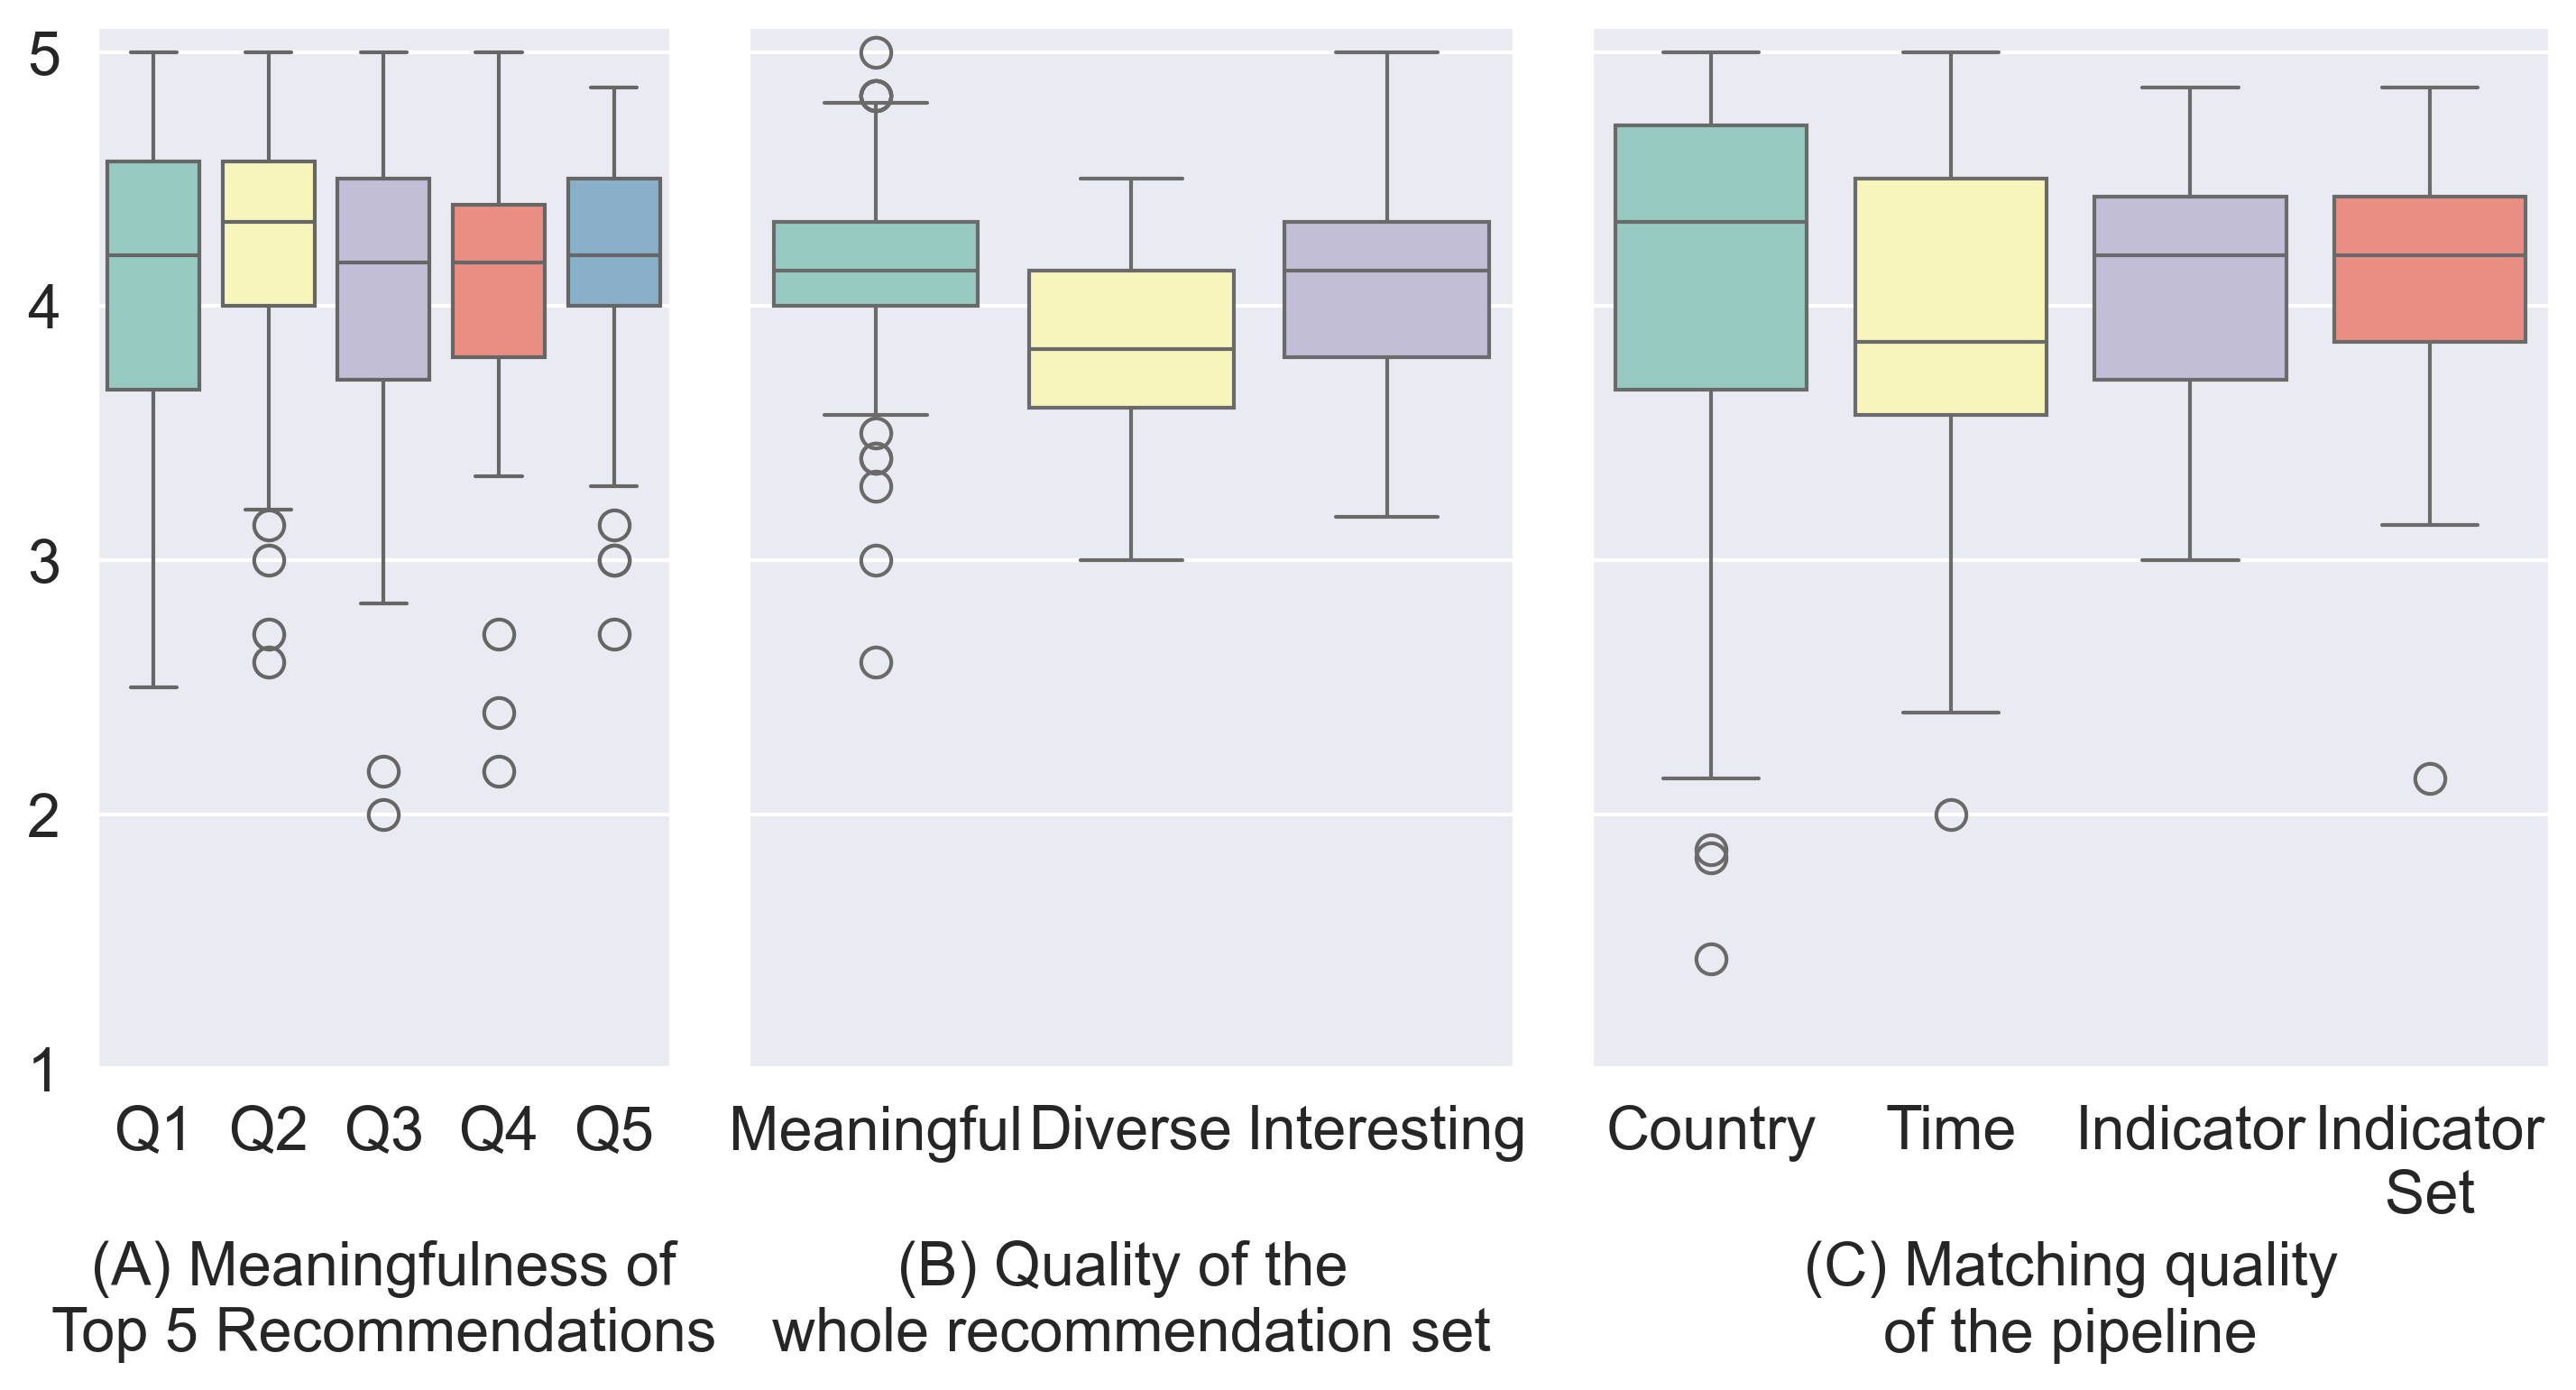
We evaluated the pipeline to verify whether the pipeline generates useful questions to explore contexts and matches the relevant data points to the statistical statements. We collected ratings from 18 external evaluations on the pipeline’s context candidate generation and data matching results with 77 statistical statements. The evaluation results showed that the pipeline was able to generate meaningful, diverse, and interesting set of context candidates and the retrieved data points were relevant to the statement.
We conducted a user study with 21 participants to evaluate how DataDive supports readers explore more contexts around statistical statements and gain more knowledge on the topic of the text.
Participants valued that in-text highlights of statistical statements and recommendations of context candidates encouraged them to explore more external data. Participants also valued that using DataDive helped them be more knowledgable about the statistical indicators and read the text more critically.
@inproceedings{kim2024datadive,
author = {Kim, Hyunwoo and Le, Khanh Duy and Lim, Gionnieve and Kim, Dae Hyun and Hong, Yoo Jin and Kim, Juho},
title = {DataDive: Supporting Readers' Contextualization of Statistical Statements with Data Exploration},
year = {2024},
isbn = {9798400705083},
publisher = {Association for Computing Machinery},
address = {New York, NY, USA},
url = {https://doi.org/10.1145/3640543.3645155},
doi = {10.1145/3640543.3645155},
abstract = {Statistical statements that refer to data to support narratives or claims are commonly used to inform readers about the magnitude of social issues. While contextualizing statistical statements with relevant data supports readers in building their own interpretation of statements, the complexity of finding contextual information on the web and linking statistical statements with it impedes readers’ efforts to do so. We present DataDive, an interactive tool for contextualizing statistical statements for the readers of online texts. Based on users’ selections of statistical statements, our tool uses an LLM-powered pipeline to generate candidates of relevant contexts and poses them as guiding questions to the user as potential contexts for exploration. When the user selects a question, DataDive employs visualizations to further help the user compare and explore contextually relevant data. A technical evaluation shows that DataDive generates important and diverse questions that facilitate exploration around statistical statements and retrieves relevant data for comparison. Moreover, a user study with 21 participants suggests that DataDive facilitates users to explore diverse contexts and to be more aware of how statistical data could relate to the text.},
booktitle = {Proceedings of the 29th International Conference on Intelligent User Interfaces},
pages = {623–639},
numpages = {17},
keywords = {Contextualization, Data visualization, Reader support},
location = {Greenville, SC, USA},
series = {IUI '24}
}
![]()
![]()
This work was supported by the Institute of Information & Commu- nications Technology Planning & Evaluation (IITP) grant funded by the Korea government (MSIT) (No.2021-0-01347, Video Interaction Technologies Using Object-Oriented Video Modeling). Dae Hyun Kim is partly supported by the G-CORE Research Project grant at KAIST.